Every decision you make has to deal with uncertainty in some way, whether it’s a big (dis-)investment, project commitment, policy or product change. Too often do decision-makers try and fail to juggle these uncertainties in their heads while weighing the alternatives, to ultimately make a choice which is biased and subjective. Even when using commonly known techniques like a decision making matrix, a risk heat map or expert assessments, instead of statistics and science, the decisions you make are still flawed and don’t produce optimal chances of success.
However, the actively researched discipline of decision science, complemented by statistics and data science enables you to make optimal decisions for your organization.
CTR Consulting helps you reduce uncertainty, presents the pros and cons of alternative choices in probabilities and monetary value and ultimately enables you to make the objectively best decision. Several levels of analysis are possible depending on the decision and your organization’s needs.
Basic Analysis
This analysis takes the form a quantitative risk register and is best served to form a high-level overall picture of your organization’s risk profile in a given domain. It consists of identifying and assessing generally stated risk events in terms of their likelihood and potential damages incurred. The individual assessments are corrected for correlation and aggregated.
Akin to a more commonly used risk register, this method will result in a risk inventory with their individual likelihood and potential damages and a total result. However, instead of using scales or categories for assessing the risks – such as “Highly Likely” or the color dark orange – this analysis will produce graphs and statistics that inform you of the actual number of expected operational occurrences or estimated range of losses to a specific issue within a department for example. Because the analysis produces numbers, not ratings, sensitivity analysis is possible and enables you to identify those mitigating measures with the most value for cost.
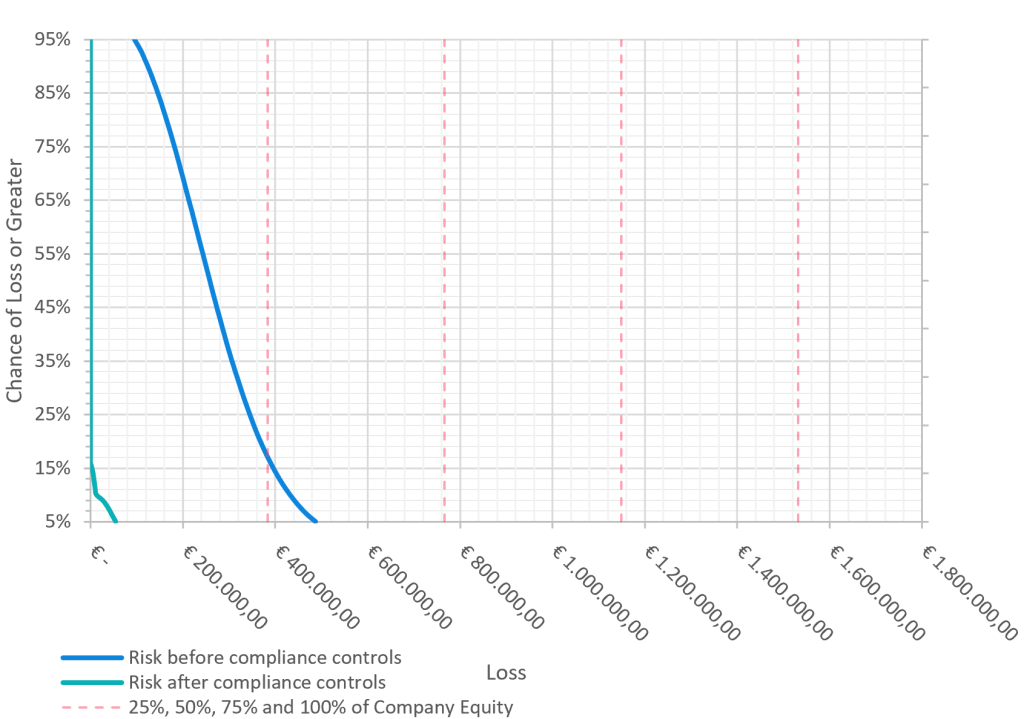
The final output of this analysis consists of an easily reportable snapshot of your organization’s risk profile within the given domain in the form a graph illustration called the “Loss Exceedance Curve” or LEC. This curve plots the value of potential losses and their likelihoods, and can be easily plotted against a department’s budget, your organization’s equity or other relevant metrics. You can use this to guide financial planning and get a sense for areas where your organization is over- or underspending.
Advanced Analysis
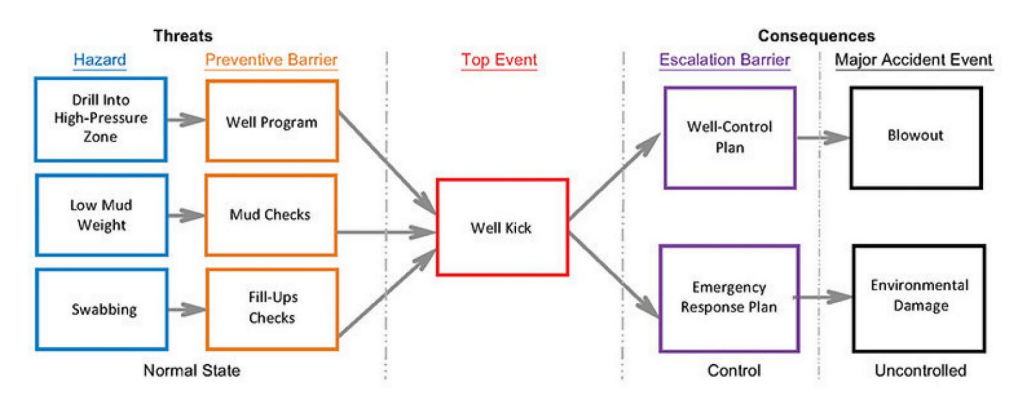
We have more tools at our disposal digging several orders of magnitude deeper. Diagram models such as bow-ties and decision trees or time series models enable visualization of complex chains of events as well as their estimated likelihoods and impacts. Instead of assessing generally defined risk events top-down, these tools enable constructing the lead-up and effects of each risk event bottom-up.
Sensitivity analysis on modeled individual risk factors enables informed and targeted efforts to reduce chances of an event occurring or its impact after it would have occurred. Akin to a Return on Investment (ROI) measure, costs of these efforts can be compared to the reduction in losses they bring, allowing your organization to find the most cost-efficient way of meeting its objectives.
The biggest value these tools bring, besides more accurate estimates, is the ability to determine which variables matter most – the ability to discern how to reduce uncertainty cost-efficiently. The value of additional information can actually be calculated and compared to the cost of acquiring it.
Ironically, too often do organizations measure what doesn’t really matter just because they can and they believe the “big risks” are too abstract or too uncertain to model and measure. It is precisely because a risk is highly uncertain, your organization’s decision-making will benefit from reducing that uncertainty.
Uniquely Optimized
As the culmination of the previous levels, this form of analysis constitutes a completely bespoke risk factor model programmed from the ground up. The possible chains of events and all of their variables are modeled in relation to each other in a unique risk model, such as a Bayesian network. While precluding plug-and-play, this enables the most precise estimates and targeted efforts.
We will work together in applying proven scientific methods and principles, unlocking your organization’s most optimal decision making.
Proper risk management helps you analyze what matters and estimate the probable outcomes of a set of actions, thus pointing you to the right one.
Get in touch to learn more about which level of analysis would best suit your organization’s needs.